
Learning Center
Retirement Income Gap Calculator for FERS
The median baby boomer was projected to face a $9,000 annual retirement-income shortfall in 2025, nearly one-quarter of projected expenses, according to Vanguard's retirement outlook. For a federal employee, the useful question isn't whether retirement income falls short. It's which years fall short, especially when the FERS supplement ends before a delayed Social Security claim begins.
The Gap Is Spending Minus Reliable Income
A retirement income gap calculator answers a cash question, not a balance question: how much of your spending remains unpaid after that year's income arrives? A substantial TSP balance can help fund the answer, but it isn't itself an annual paycheck.
Start with this formula:
Annual gap = essential spending + discretionary spending + taxes + healthcare premiums − FERS or CSRS annuity − Social Security or FERS supplement actually payable − planned TSP withdrawal − other reliable income.
A positive result means money is still missing after the planned withdrawals. A negative result means projected income exceeds the spending target, leaving some room for reserves or unexpected costs.
For federal employees, run the calculation in age bands, not once for an entire retirement. Your annuity, supplement, and Social Security have different payment schedules, so averaging them together can conceal years when you need substantially more from savings.
Use a household budget as the starting point, rather than a percentage of salary. Our guide to calculating retirement income needs for federal employees can help you organize that target.
Keep the spending plan visible while you enter the income figures.

If calculators disagree, compare their assumptions before comparing their conclusions. Wealth Collective's discussion of making sense of conflicting retirement projections offers useful context for that exercise, although your federal-benefit inputs must remain specific to your own retirement system.
For a first pass, gather these records:
- Pension: An annuity estimate, or your high-3 and creditable service.
- Social Security: Your personal benefit statement.
- TSP: Your latest account statement.
- Spending: A retirement budget that includes taxes and healthcare.
Federal Income Inputs the Calculator Needs
Gather the records before opening the calculator. Otherwise, it's easy to combine a gross pension estimate, an after-tax work estimate, and an optimistic spending target without noticing that they use different definitions.
For your pension, identify your retirement system, high-3 average salary, creditable service, and intended survivor election. Confirm whether military service deposits have been completed before including that service in an estimate. Don't assume that every service date on a personnel record establishes the same retirement credit.
What each federal input becomes in the gap formula
Copy this table into a spreadsheet and add a column for the document supporting each entry.
| Input | What to enter | Annual cash it creates | Start or stop |
|---|---|---|---|
| FERS annuity | High-3, verified service, applicable multiplier, survivor election | High-3 × years × applicable multiplier, minus survivor reduction | Use the annuity commencement date and applicable FERS COLA treatment |
| CSRS annuity | CSRS service and high-3 under CSRS rules | CSRS accrual, not the FERS percentage | Use the commencement date and applicable CSRS COLA treatment |
| FERS supplement | Annual estimate, adjusted for any applicable earnings test | The supplement actually payable | Through the supplement's ending date; count transition-year payments by month |
| Social Security | Statement estimates at early, full-retirement-age, and delayed claiming dates | Annual benefit for the age claimed | Starts with the benefit entitlement and payment schedule selected |
| TSP | Balance, labeled withdrawal assumption, traditional and Roth amounts | Balance × withdrawal rate for the initial estimate | Continues only while assets support the planned withdrawals |
| Other income | Military retired pay, net rent, or planned work, with an end date | Annual net amount, consistently defined | Stop temporary income when the work or payment ends |
| Spending need | Essentials, discretionary items, taxes, FEHB or PSHB premiums | The annual target against which income is measured | Rebuild the budget when coverage, taxes, or household circumstances change |
Keep CSRS separate from FERS. A FERS calculation pasted onto a CSRS career won't produce a meaningful pension estimate. Likewise, a basic formula isn't a substitute for an estimate that reflects your retirement category and elections.
Match each estimate to its supporting record
Your Social Security statement should supply the benefit estimates for the claiming dates you're comparing. Check the assumed future earnings behind those estimates, especially if you intend to stop working earlier than the statement assumes.
For TSP, record both the account value and the proposed annual withdrawal. Separate traditional and Roth holdings for tax planning, but don't treat either label as an additional source of income.
Other income needs an honest expense allowance. For rental property, use the amount available after property expenses, not the rent collected before maintenance, vacancies, and insurance.
Healthcare needs its own budget lines: the retiree-paid FEHB or PSHB premium, medical out-of-pocket spending, and any other coverage costs you expect. If taxes appear in the spending target, avoid also subtracting the same taxes from income.
To make our calculations most accurate, we ask clients for their SF-50, a recent pay stub or LES, TSP statement, and Social Security statement. Those records help replace assumptions with pay, service, and benefit facts.
How to Calculate the Annual Gap
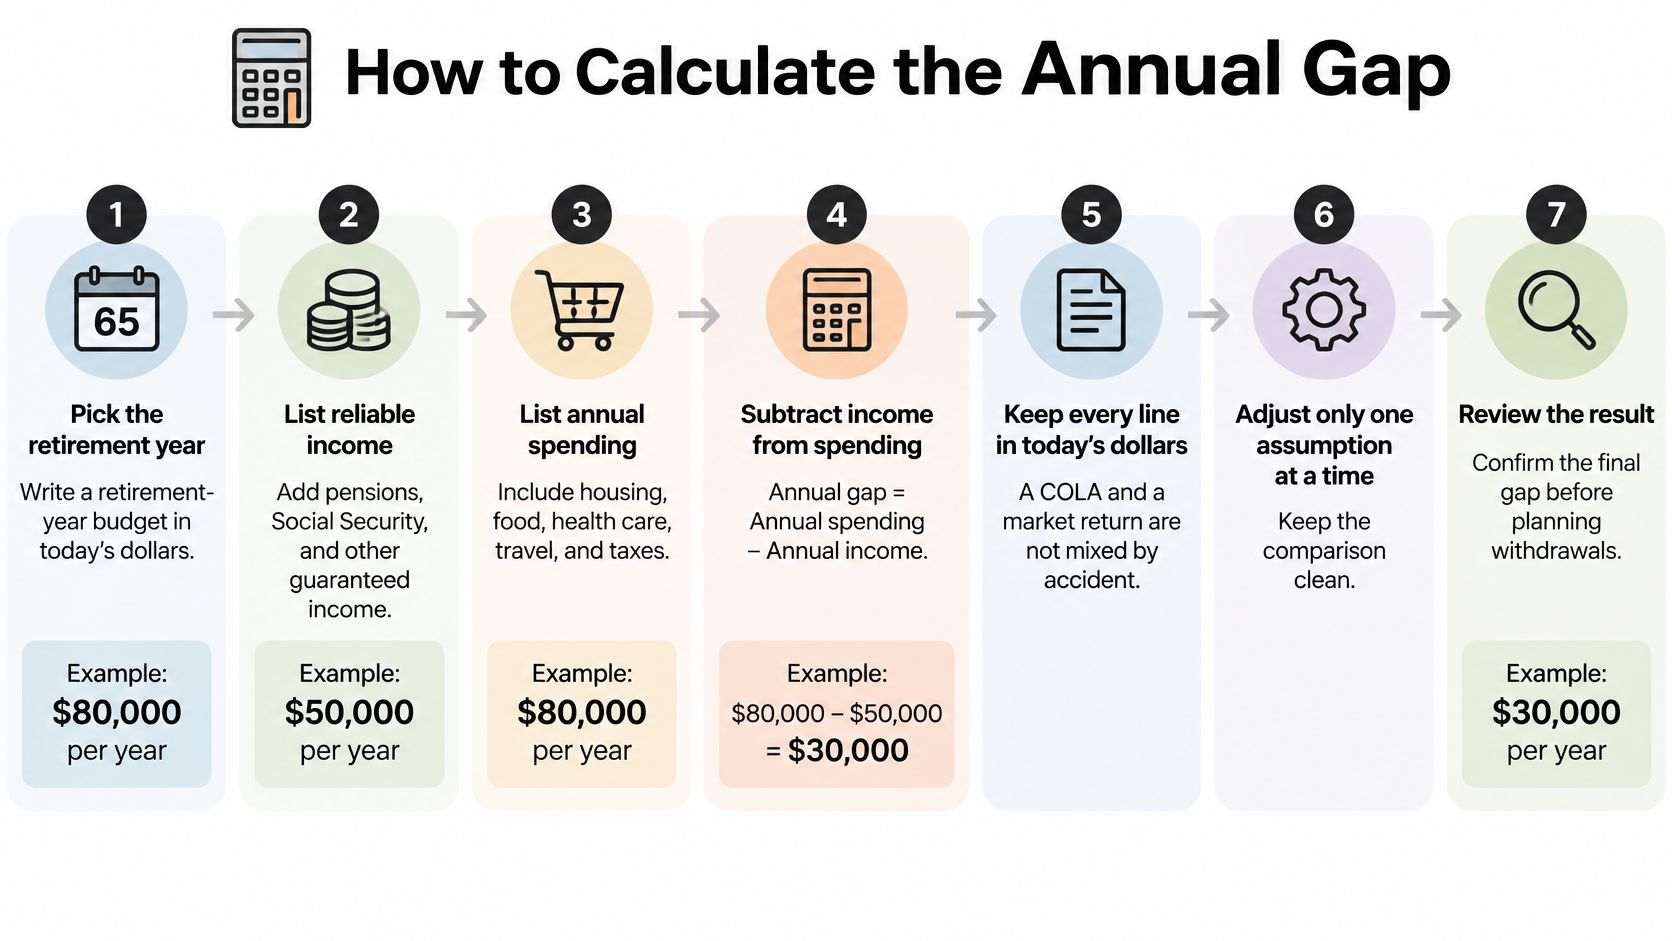
Use today's dollars throughout the first calculation. That means every income and expense entry represents purchasing power on the same basis, rather than mixing a future inflated pension with today's grocery bill.
The process graphic provides a quick reference while you build the worksheet.
Build the cash-flow calculation
Pick the retirement year and spending target. Separate essentials, discretionary purchases, income taxes, and FEHB or PSHB premiums. Add medical out-of-pocket costs and identify any potential long-term-care expense separately.
Enter the pension estimate. Use your verified high-3, creditable service, and applicable accrual rules. Subtract the survivor election reduction you expect to choose, rather than using an unreduced pension you won't receive.
Place the supplement only where payable. In the age-band model, end the FERS supplement at 62. Leaving it in later years would disguise the funding needed between its end and your Social Security claim.
Start Social Security at the selected claiming age. If you plan to claim at 67, leave earlier bands without that income. Retirement from federal service doesn't automatically start Social Security.
Convert TSP savings into a stated withdrawal. Write down the dollar draw and the rule used to select it. Keep the balance on the asset worksheet, not in the annual-income total.
Subtract income from spending within each band. Separate retirement before the supplement ends, the period before Social Security begins, and the years after claiming. This is what exposes a temporary bridge requirement instead of burying it in a lifetime average.
Label the assumptions beside the result. Identify today's dollars, withdrawal policy, survivor elections, and premium assumptions. A flat-dollar illustration helps explain timing, but a planning model also needs inflation, investment, and longevity testing.
Age-band gap worksheet
| Age band | Spending need | Guaranteed income | TSP withdrawal |
|---|---|---|---|
| Retirement to 61 | Essentials, discretionary spending, taxes, premiums | Annuity plus eligible FERS supplement | Balance × labeled withdrawal rate |
| 62 until Social Security starts | Budget in consistent today's dollars | Annuity only; supplement at $0 | Planned withdrawal for this band |
| Claiming age onward | Updated household budget | Annuity plus Social Security at the claimed amount | Planned withdrawal for this band |
| Survivor case, any band | Rebuilt survivor budget | Elected survivor pension plus applicable Social Security survivor benefit | Withdrawal supported by remaining assets |
The survivor row is a separate household scenario, not another income stream to add to the retiree's total. Recalculate the surviving spouse's actual benefits and expenses rather than carrying forward both spouses' checks.
The Government Accountability Office's retirement-income report found commonly cited replacement-rate targets of 70% to 85%, while emphasizing that an appropriate target depends on spending, household characteristics, and earnings. A replacement percentage can provide context, but it can't identify an unpaid year between benefit start dates.
For an additional explanation of the planning process, use this video alongside your worksheet.
Before testing investment performance, confirm that the payment calendar is correct. An incorrect benefit start date won't become reliable just because a calculator runs more scenarios.
A FERS Case With a Hole Before 67
Consider Pat, a hypothetical FERS employee retiring in 2026 at age 60, with 30 creditable years and a $110,000 high-3. These are teaching assumptions, not a typical outcome for every federal employee or a substitute for an official benefit estimate.
For this illustration, Pat's applicable annuity multiplier is 1%, producing:
$110,000 × 30 × 0.01 = $33,000 annually.
Assume no survivor reduction in this initial case. Pat would need to rerun the calculation with the actual election before relying on the result.
Pat's income assumptions
Pat's hypothetical Social Security statement shows $24,000 annually at 62 and $30,000 at 67. Pat chooses the later claim and won't work after retirement.
To illustrate supplement timing, use a simplified teaching estimate of $24,000 × 30 ÷ 40 = $18,000 annually, ignoring the earnings test. This shortcut isn't an official supplement computation; actual eligibility and the payable amount require a separate review.
Pat also has $450,000 in TSP. A labeled initial withdrawal assumption of 4% produces $18,000 annually, without establishing that this draw will remain sustainable.
The timeline below accompanies the case; the worksheet specifies the supplement's assumed payment period.
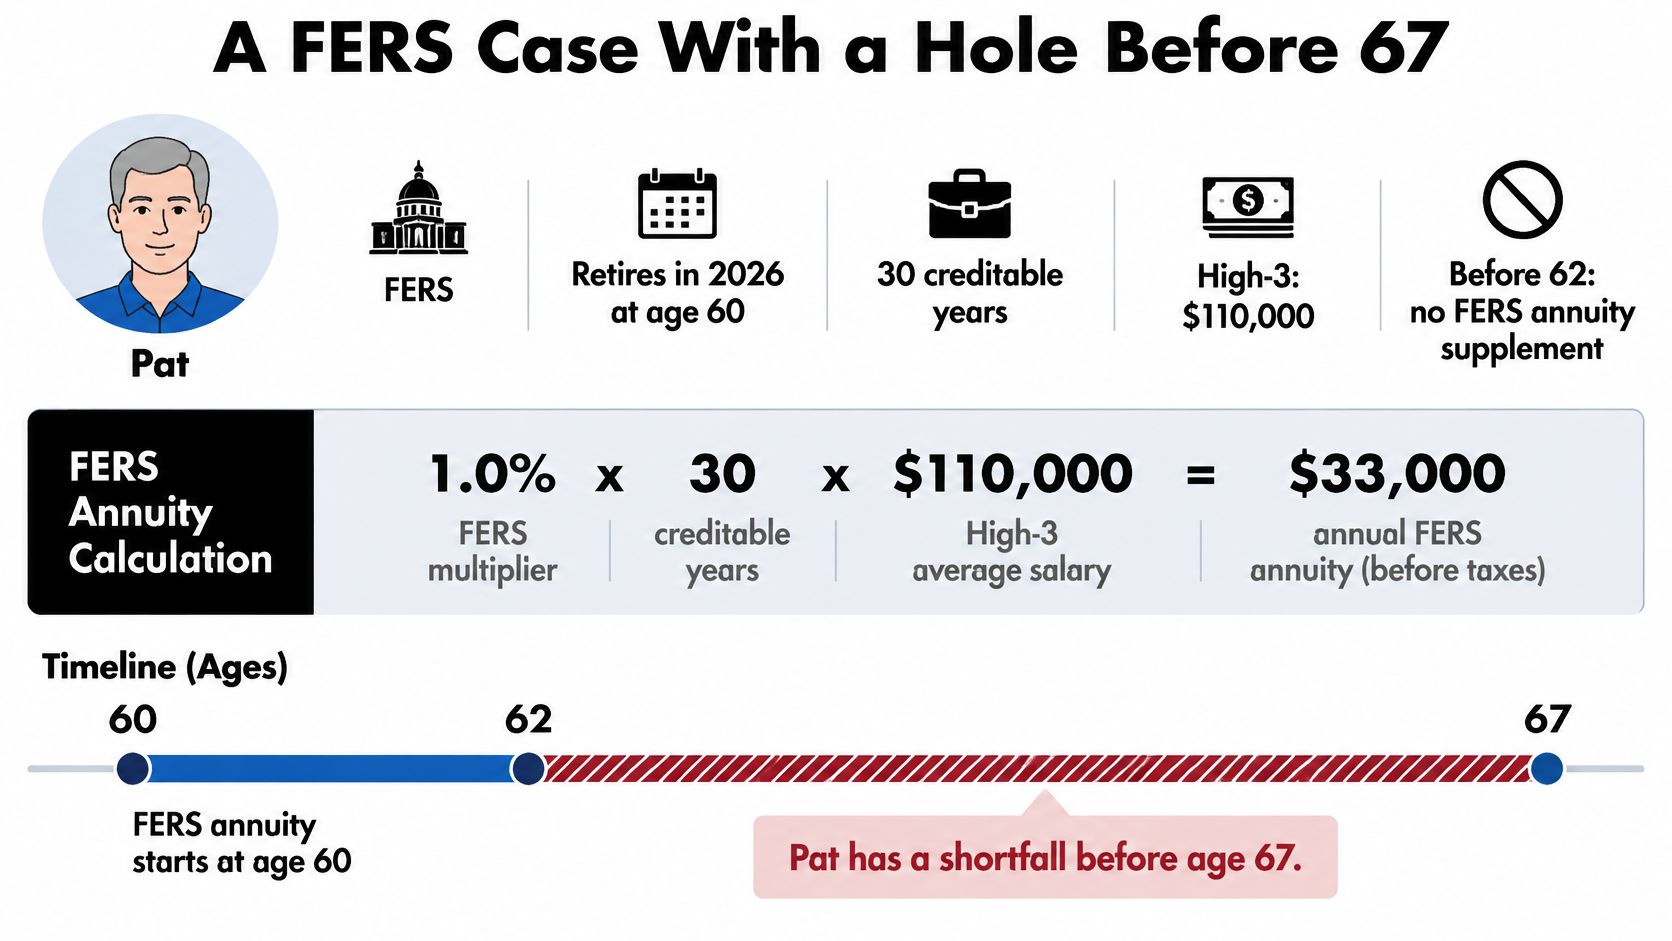
Pat's spending target is $85,000 annually in today's dollars, including an illustrative tax allowance and the retiree-paid health premium. The case assumes supplement eligibility before its ending age; use our guide to the FERS annuity supplement when reviewing how that benefit fits your own retirement.
Teaching case annual gap by age window
| Age window | Spending need | Annuity | Supplement | Social Security | Planned TSP withdrawal | Annual gap |
|---|---|---|---|---|---|---|
| 60 through 61 | $85,000 | $33,000 | $18,000 | $0 | $18,000 | $16,000 |
| 62 through 66, Social Security delayed | $85,000 | $33,000 | $0 | $0 | $18,000 | $34,000 |
| 67 and after | $85,000 | $33,000 | $0 | $30,000 | $18,000 | $4,000 |
Pat's illustrative shortfall is $16,000 annually at 60 and 61, increases to $34,000 annually from 62 through 66, and falls to $4,000 annually from 67. The largest hole appears after the supplement ends but before Social Security begins.
The gap column is additional funding needed after the planned TSP withdrawal. Pat can't describe the bridge as funded merely because the worksheet already includes a portfolio draw.
This example deliberately freezes COLAs, tax changes, and investment returns so the payment timing remains visible. It also leaves the annuity calculation to a simplified illustration; OPM determines the actual annuity.
Replace Pat's salary, service, statement benefits, savings, premium, and survivor assumptions before trusting even the sign of your own result. A different election or healthcare budget can turn apparent breathing room into a shortfall.
Reading a Surplus Against a Shortfall
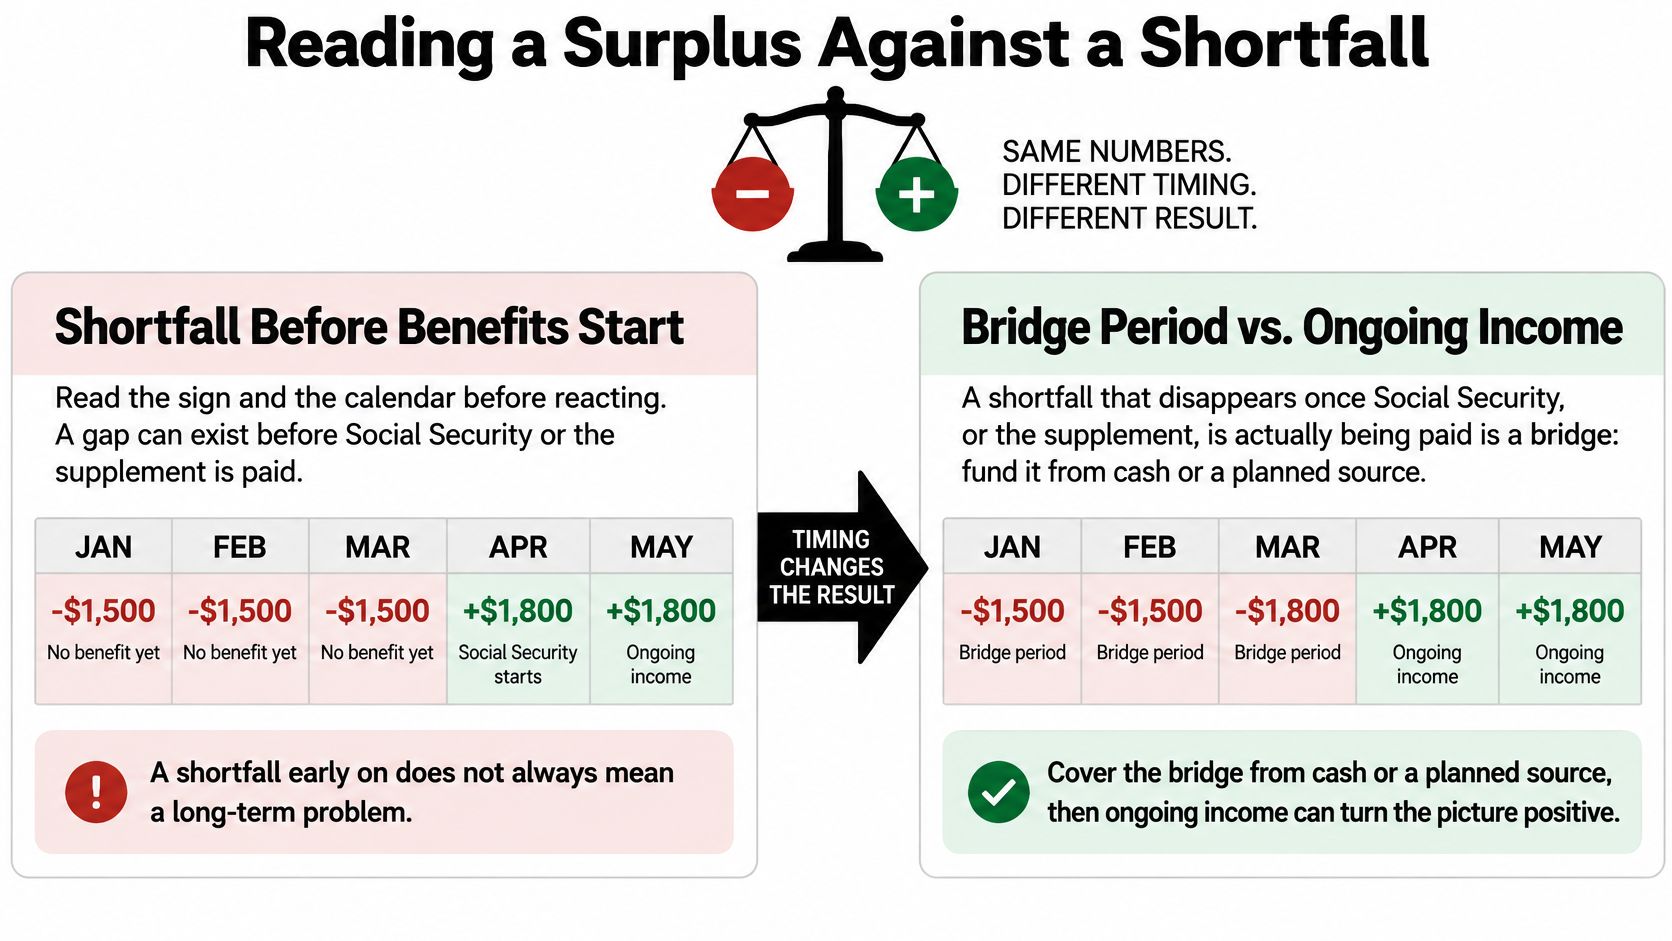
Read the sign and calendar before deciding what to change. A shortfall that ends when an expected benefit begins is a bridge gap. A shortfall that remains after your ongoing pension and Social Security income have started is an ongoing gap.
A bridge can be funded deliberately with cash reserves, additional planned withdrawals, temporary work, or a later retirement date. But the bridge plan must account for what remains in savings afterward, not just whether you can pay the first year's bills.
This comparison helps separate a payment-timing problem from an ongoing spending problem.
The funding source changes the risk
Two households can show the same initial gap and still face different risks. If one covers essential spending mostly with pension income while the other relies heavily on TSP withdrawals, an early investment loss creates a more immediate funding challenge for the second household.
Healthcare can create a similar mismatch between spending and income. A pension adjustment doesn't necessarily match the change in your particular premium or medical expenses.
The TIAA Institute retirement-income brief reports that only 12% of adults demonstrate strong longevity literacy and notes that average FEHB premiums rose 13.5% in 2025. Those findings support testing both a longer retirement and healthcare costs separately from general household inflation.
Stress tests that change the same gap
| Scenario | Change from the base case | What happens to the gap |
|---|---|---|
| Base case in today's dollars | Annuity, supplement through its ending age, labeled TSP draw, flat spending | Shows the payment-timing shortfall, without proving long-term sustainability |
| Long life for a couple | Extend the projection and add a survivor scenario | More withdrawals may be needed; survivor income must be recalculated |
| Healthcare ahead of general inflation | Model premiums and out-of-pocket costs separately | Essential spending can increase faster than income adjustments |
| Down market in year one | Continue planned withdrawals while TSP assets fall | The same dollar withdrawal uses a larger share of remaining assets |
Don't assume the surviving spouse keeps the original household income. Model the survivor pension election, applicable Social Security benefit, and revised household costs together.
For the portfolio-funded portion, compare payment methods using our guide to TSP withdrawal options in retirement. The withdrawal method should fit the spending need, while the sustainability test evaluates whether the assets can support it.
Practical rule: Fund the bridge deliberately, then test the retirement that remains after crossing it.
A surplus deserves scrutiny too. Before treating it as spendable, check whether the model includes irregular home expenses, medical exposure, and the survivor household.
Mistakes That Shrink the Gap on Paper
A tidy result can come from incorrect inputs rather than a workable retirement plan. Use these checks before making a retirement-date decision.
Check the target and the payment calendar
Using gross salary as the spending target. Working pay includes dollars that may go to retirement contributions, payroll deductions, and work-related costs. The American Academy of Actuaries' retirement-adequacy discussion notes that there's no universally accepted adequacy measure and that retirees may reduce spending over time. Build essential, discretionary, and legacy goals separately rather than treating a salary percentage as a budget.
Giving both benefits a full transition year. The supplement and Social Security can appear in the same calendar year without overlapping for the entire year. Enter the months each benefit is payable; don't ban both from sharing a calendar year, and don't credit both as full-year payments.
Treating the TSP balance as annual income. An asset total describes resources available to fund withdrawals. Entering it alongside annual pension payments can make an unfunded budget appear comfortably covered.
Check elections, claims, and dollar units
Ignoring the survivor election. If you expect to elect survivor coverage, use the reduced retiree annuity in the household calculation. In the survivor scenario, use the survivor benefit itself, not the original pension minus the retiree's election cost.
Assuming an earlier Social Security claim is a free bridge. Compare your own statement amounts at the proposed claiming dates. Earlier income may help the immediate cash need, but the changed ongoing benefit must also be entered in every later band.
Mixing future dollars with today's spending. A nominal investment return isn't an annual paycheck, and a future benefit estimate isn't automatically comparable with a current-dollar budget. Keep the dollar basis consistent, then test purchasing power over time.
These checks should produce changes you can explain. If the result improves, identify whether you reduced spending, increased reliable income, changed timing, or accepted greater portfolio risk.
If the gap shrinks only because benefits received extra months, an account balance became income, or gross pay replaced a household budget, rerun the worksheet before choosing a retirement date.
Run the Numbers From Your Own Records
Copy the age-band worksheet and replace every teaching assumption with your own service history, salary, benefit estimates, savings, and healthcare costs. Keep the supporting documents beside the spreadsheet so you can distinguish a verified entry from a placeholder.
Choose an action for each unfunded band. Don't leave a positive gap with an unexplained assumption that savings will somehow cover it.
Turn the worksheet into a decision
- A temporary gap: Identify the specific cash reserve, planned withdrawal, work income, or retirement-date change that will fund it.
- An ongoing gap: Reconsider the spending target, retirement date, or savings plan rather than increasing a withdrawal percentage.
- An apparent surplus: Test healthcare, longevity, investment losses, and survivor income before committing it to additional spending.
For employees who want the calculation built from their own records, our Free Gap Report is prepared after a short intake call. It uses your service history and salary to project retirement income and flag possible shortfalls, rather than substituting a sample salary for your circumstances.
We're independent and aren't affiliated with or endorsed by the Office of Personnel Management, Social Security Administration, Federal Retirement Thrift Investment Board, or any government agency. Official benefit determinations remain separate from an educational projection.
Bring real pay and service facts to any calculator. Your retirement decision should rest on a funded payment calendar, not a single lifetime replacement percentage.
Federal Benefits Sherpa offers a free Gap Report to help you see how your pension, supplement, TSP income, and Social Security timing fit your retirement budget. Visit Federal Benefits Sherpa to arrange a short intake call, and have your SF-50, recent LES, TSP statement, and Social Security statement ready so the calculation starts with your own numbers.


Dedicated to helping Federal employees nationwide.
“Sherpa” - Someone who guides others through complex challenges, helping them navigate difficult decisions and achieve their goals, much like a trusted advisor in the business world.
Federal Benefits Sherpa, LLC
12724 Gran Bay Parkway West, Suite 410, Jacksonville, FL 32225
Email: [email protected]
Phone: (833) 753-1825
© 2024 Federalbenefitssherpa. All rights reserved
Federal Benefits Sherpa is an independent organization and is not affiliated with or endorsed by the U.S. government or any federal agency.